I live in Victoria B.C., on the edge of the Pacific Ocean. Once you navigate the Strait of Juan de Fuca to the sea, you soon find yourself on the vast ocean with no land in sight. The rolling waves are a dizzying blend of power and beauty, making it all too easy to lose one’s sense of direction.
When night falls and the vast expanse of stars fills your vision, the power of nature becomes all the more overwhelming. I marvel at how sailors navigated the vast oceans before the invention of the compass and the modern miracle that is GPS. We often take these conveniences for granted today, but for the sailors of old, celestial navigation was one of the only reliable methods to traverse the seas.
For much of human history, sailors relied on stars like Polaris, or the “North Star,” to guide them on their journeys. While other stars appear to move in the sky, Polaris remains fixed, providing a constant point of reference. To the untrained eye, bright planets like Venus and Jupiter or other luminous stars like Sirius and Vega could be mistaken for Polaris, leading some off course. More seasoned navigators would use constellations like the Big Dipper, to accurately locate the North Star.
There are significant parallels between how sailors navigate the seas and how investors navigate financial markets. Just as a sky filled with countless stars can mislead amateur navigators astray, the plethora of financial and economic indicators can easily lead investors off track—especially during times dominated by fear or greed.
So the question becomes: Just as sailors look to Polaris for navigating oceans, do investors also have their own “North Star” for navigating financial markets? Let’s look at a few of the tools that are used.
The Buffet Indicator
As one of the most prominent figures in investing, Warren Buffett is a household name known to every investor. His teachings are often viewed as timeless, and for many investors, he is their North Star. It’s no wonder then that some investors may look at an indicator named the “Buffett Indicator” as a potential guiding light for market timing, even if Buffett is known for quotes like, “Time in the market beats timing the market.”
The Buffett Indicator originated from a 2001 Fortune article where he measured the ratio of the total market value of U.S. stocks against the Gross National Product (GNP), showing that at the peak of the dot-com bubble, the ratio was an unsustainable 190%. The article states that while the ratio has “certain limitations in telling you what you need to know,” it is “probably the best single measure of where valuations stand at any given moment.”
If we calculate the Buffett Indicator today by using the Wilshire 5000 Index as a proxy for the total U.S. stock market value, the indicator stands at 196% as of Q3 2024 ($57,637/$29,388), higher than what the ratio was before the dot-com bubble burst.
Does this mean that a dot-com-like crash is imminent?
Well, not exactly. Despite being named after him, Buffett himself has dismissed the usefulness of the indicator in subsequent interviews following the 2001 article, citing that it was a reference to the dot-com bubble and not meant to be a fine-tuned indicator. Moreover, Buffett has not spoken publicly about the metric in recent years despite the ratio reaching all-time highs.
One major issue with the indicator is that GNP does not fully account for international sales and the effects of globalization. Some sources estimate that the S&P 500 generates 41% of its revenue from overseas. While market capitalization would account for international sales, GNP is limited in capturing the full complexities of a globalized economy and tends to skew the ratio to the upside.
The indicator also overlooks the effects of interest rates. In a low-interest-rate environment, equities become relatively more attractive compared to bonds because bond yields are low, which tends to drive up equity prices. Although interest rates are much higher today compared to a few years ago, the 10-year U.S. yield is still a way off from the 6.7% yield in early 2000.
While this indicator may not have withstood the test of time and is more akin to false North Stars like Sirius or Vega for navigating markets, it doesn’t mean that this metric is entirely useless. The idea of measuring overall economic output against total equity market value remains fundamentally sound. In the long-run, equity valuations are driven by the output of goods and services that companies produce.
With some tweaking and backtesting to address the issues mentioned above, a modified Buffett Indicator adapted to modern economic conditions might be still useful. Nevertheless, it is a lesson to not trust an indicator because it bears a famous person’s name—especially if that person doesn’t even use it anymore.
CBOE Volatility Index
For investors seeking short-term signals on market fear, the CBOE Volatility Index, otherwise known as the “VIX,” might serve as their guide through choppy seas. The VIX is one of the most well-known indicators for measuring market volatility, capturing the 30-day expected volatility of the U.S. stock market. As the saying goes, “the markets take the stairs up and the elevator down,” which means high volatility is synonymous with significant market drops.
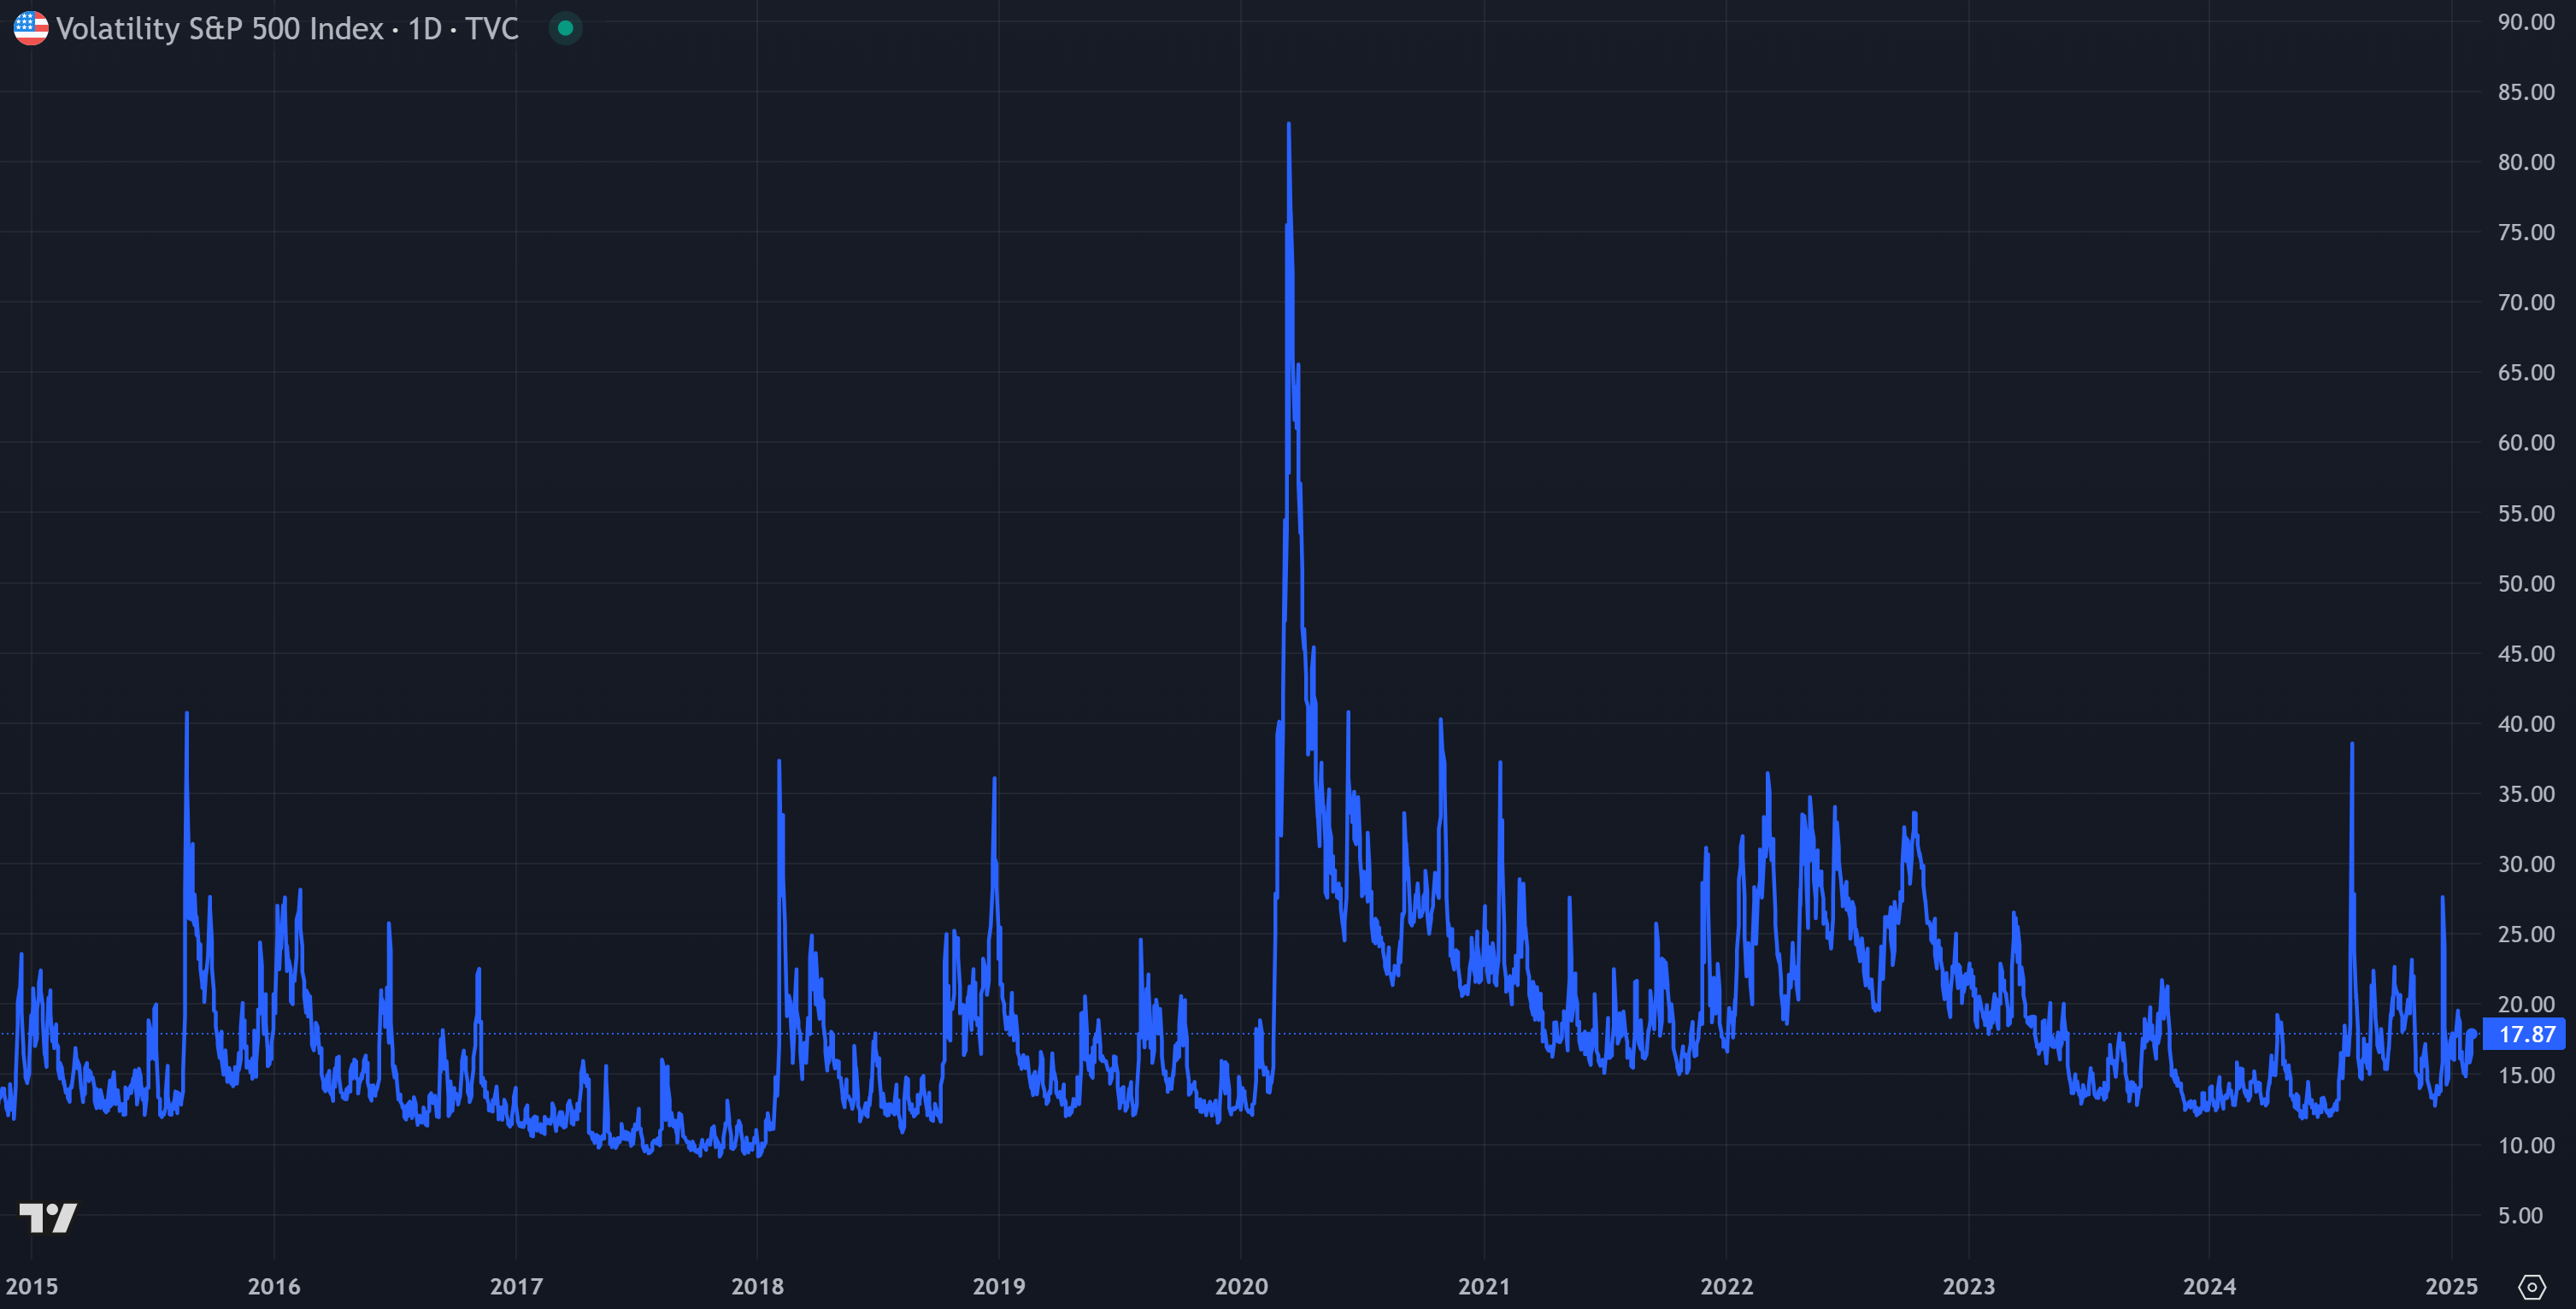
As illustrated in the chart above, the typical pattern of the VIX is within a range of 10-25, which demonstrates “normal” market conditions. Occasionally, the VIX spikes, often due to negative news and increased uncertainty. Most recently, the VIX spiked to a high of 38 in August 2024 due to the unwinding of the yen carry trade, which fueled a sell-off in U.S. equities. Historically, spikes in VIX above 40 have signaled major sell offs, and spikes above 50, such as what occurred in the 2020 pandemic, indicate substantial fear within markets.
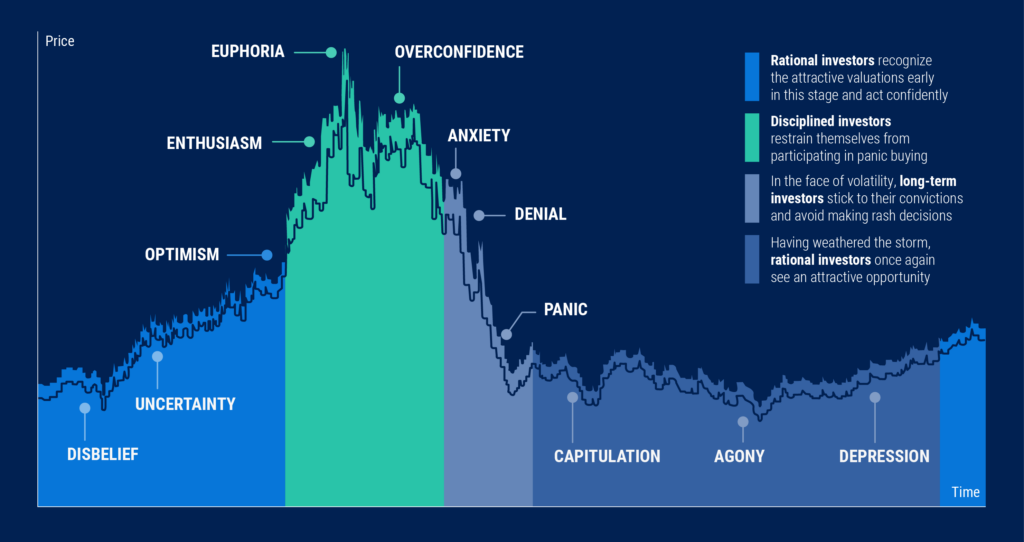
As Buffett famously advised: “Be fearful when others are greedy and be greedy when others are fearful.” Since the VIX is a barometer for fear, spikes in VIX can be used to identify the later stages of short-term market cycles where investors capitulate. Historically, any spikes above 40 in the VIX have been opportune times to enter the market. For courageous investors who can stomach periods of heightened volatility, the VIX acts as a North Star, guiding them through turbulent markets without succumbing to irrational fear.
Are anecdotes ever useful?
Some investors take tips or anecdotes shared with them as a guiding light to make an investment choice. More often than not, they are about as accurate as mistaking an airplane flying overhead for a star.
Many of you may have heard the anecdote about Joe Kennedy, who realized it was time to exit the market when a shoeshine kid started giving him stock tips. Similarly, there are anecdotes of people buying second and third homes with plans to flip them for profit before the 2008-2009 financial crisis.
In Joe Kennedy’s case, it was rumored that he engaged in insider trading and market manipulation tactics. The shoeshine kid story might have been a ruse to conceal what was really happening behind the scenes. While sometimes shared with the intent of being helpful, the issue with anecdotes is that they are difficult to validate and quantify..
Finding your North Star
There is likely no single indicator that can serve as an investor’s North Star for precisely timing market tops or bottoms. However, a combination of indicators and an investor’s market experience over many market cycles can be like the Big Dipper, helping one to identify where the North Star might be located, even if it remains somewhat elusive.
Investors should never rely solely on a single indicator. Instead, they should understand the underlying logic behind each indicator they use and identify their respective strengths and weaknesses. As Buffett said, “Markets can remain irrational longer than you can remain solvent.” While it’s important to obtain a general understanding of the state of markets and wisely shift from being more aggressive to defensive, no one possesses a crystal ball for perfect market timing. Investors should position themselves prudently based on available information without succumbing to herd mentality or psychological biases like confirmation bias.
For the more adventurous at heart, perhaps the secret formula is waiting to be found. For me, understanding the businesses I invest in and focusing on company fundamentals—such as cash flows, return on invested capital, competitive moats, and margin of safety—has served as my own “North Star.”